Interactive Visualization for Medication Adherence Exploration
Introduction
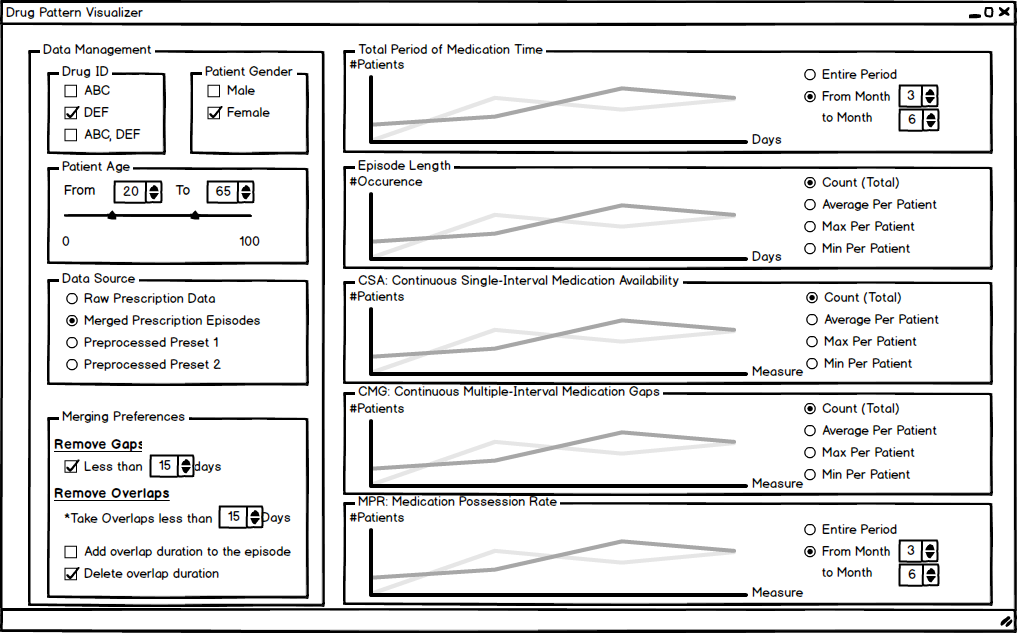
In this project, we introduce an interactive visualization tool, Pills, that analyzes the electronic medical prescription records and visualizes statistical measures relating to medication adherence. This tool provides dynamic user control to explore the duration and length of gaps and overlaps and to dynamically adjust parameters of the analysis. It also provides userdefined data group to facilitate custom analysis with demographic data (gender, age) as well as medical data (prescribed drug, medication lifetime).
Why
Drug prescription record that contains the prescription history of a patient is
valuable information for medical practitioners as well as pharmaceutical researchers. This
information helps practitioners better understand a patient's medical condition
and provide appropriate medical treatment. However, analyzing drug prescription record is
challenging and time-consuming because the data is massive and the data scheme is not well
organized. Even after some statistical values are obtained,
it is still difficult to discover general patterns and useful insights by just viewing the
numbers.
This tool helps doctors and researchers better understand the pattern in which patients
consume a drug.
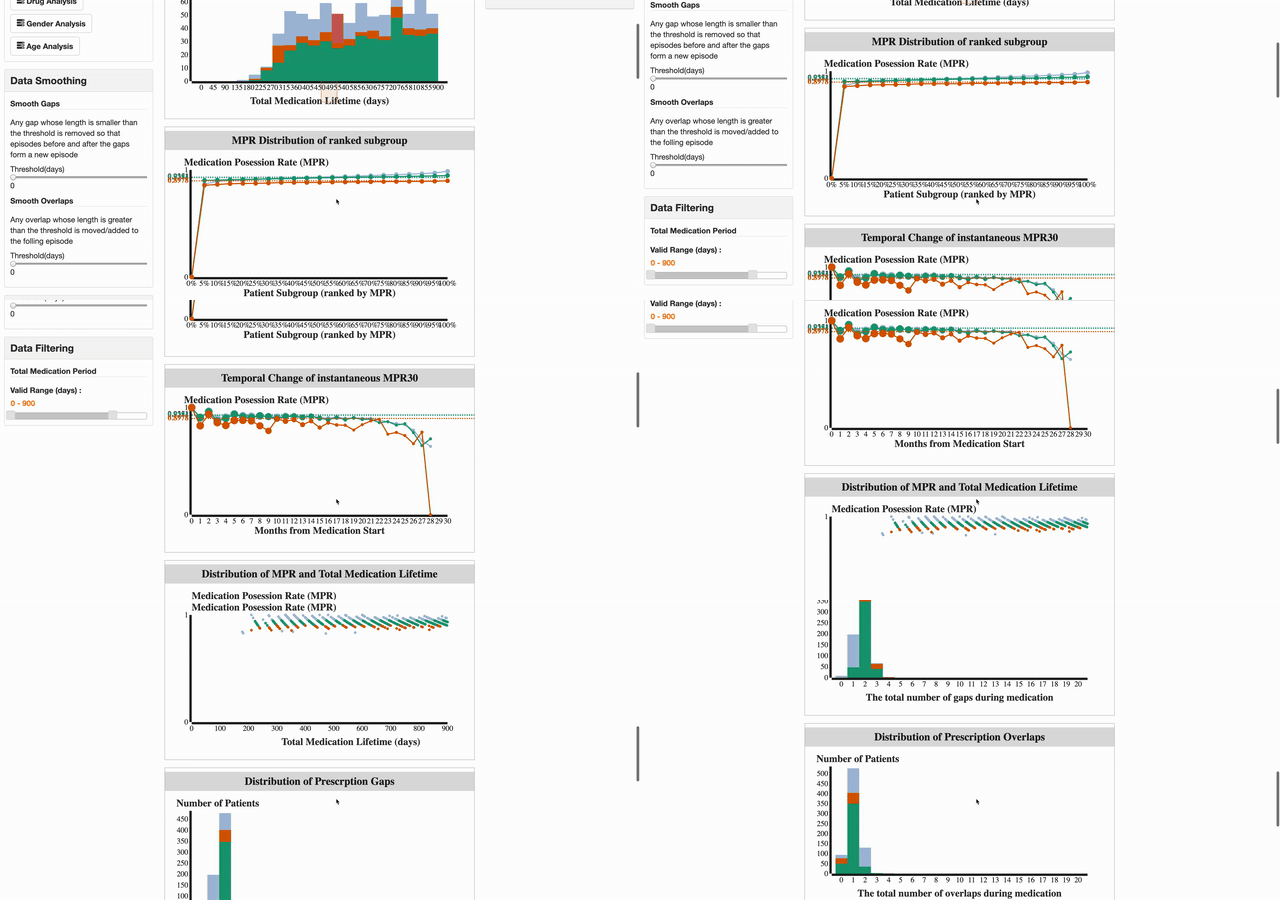
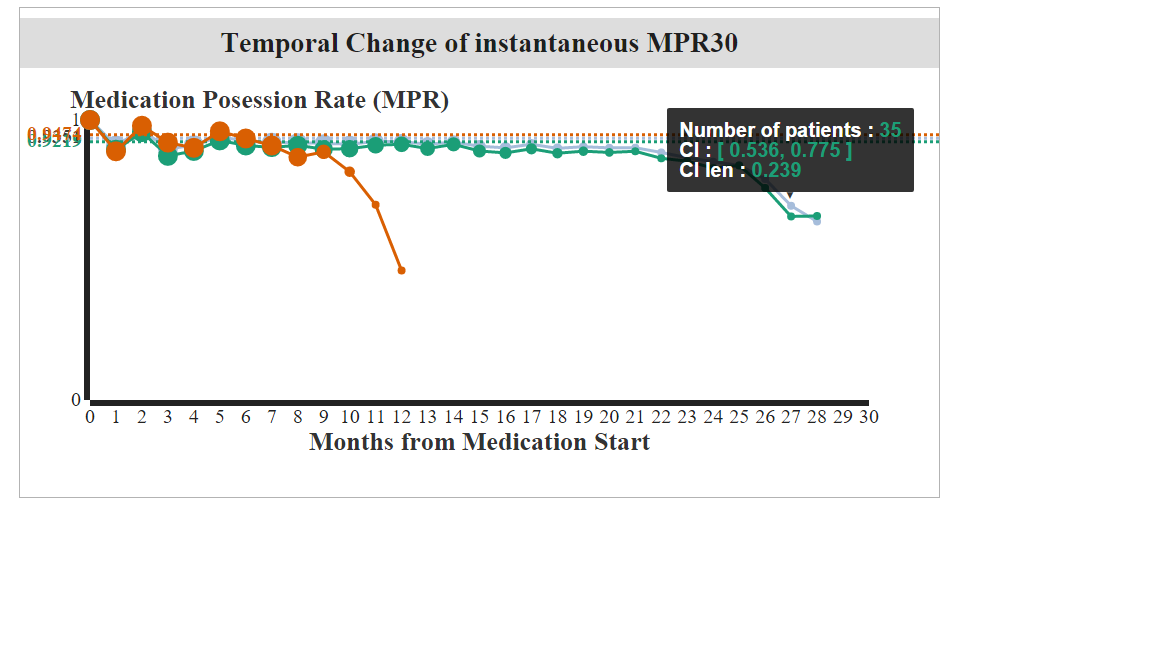
Live Prototype
My Role
The team consisted of a software engineer, UI designer, UX designer, and medical
researcher. I was actively involved in all phases of the project but was mainly
responsible for visualization, prototyping, and user testing.
My Contributions:
Research - 30%
Ideation - 10%
Experience strategy - 30%
Planning and scope definition - 40%
Prototyping - 70%
Final design - 70%
Programming and implementation - 50%
User testing - 90%
Data
The dataset we used for prototyping had approximately 10,000 prescription
records for 1,000 patients taking up to five drugs. Each prescription record has
four fields: patient ID, drug ID, prescription start date, and end date.
MPR (Medication Possession Ratio) is the ratio of the total number of days
patients are supplied a drug to the total number of days patients actually take
the drug. It indicates how well a patient adheres to the drug throughout the
medication period.
User Interface Design and Prototype
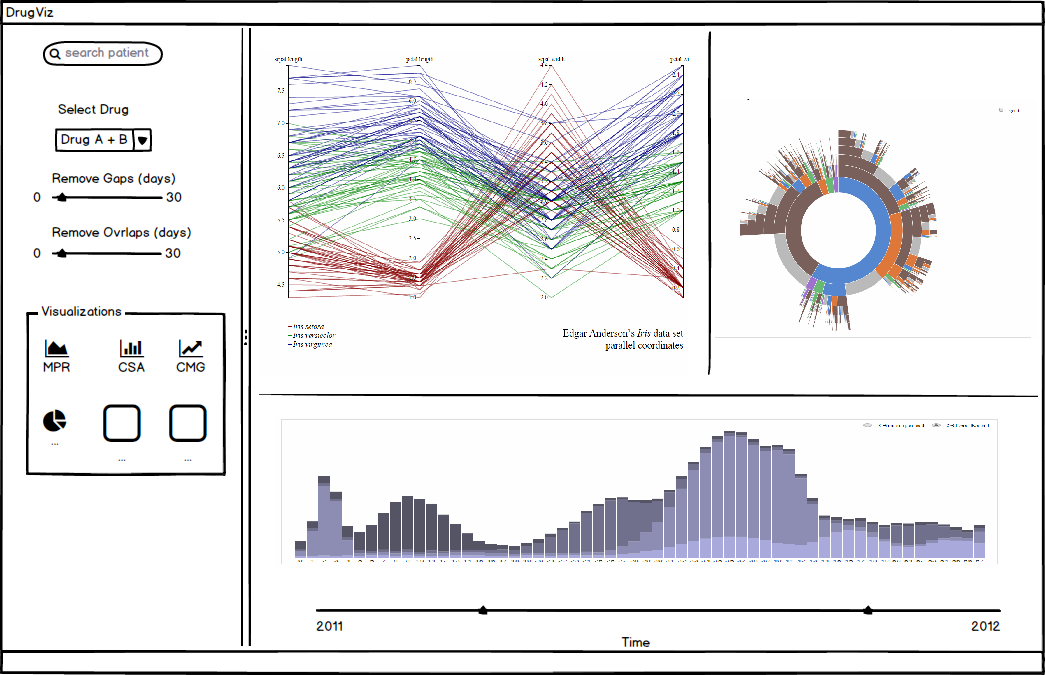
We brainstormed two different initial designs (see the the designs in the image
gallery below). We required the designs to have two common properties:
1. Dynamic inquiries for information exploration: select drug types, select
gender, select age, modify gaps and overlaps length
2. Information visualization to view the data: value distribution of the
measures, temporal change of the measures
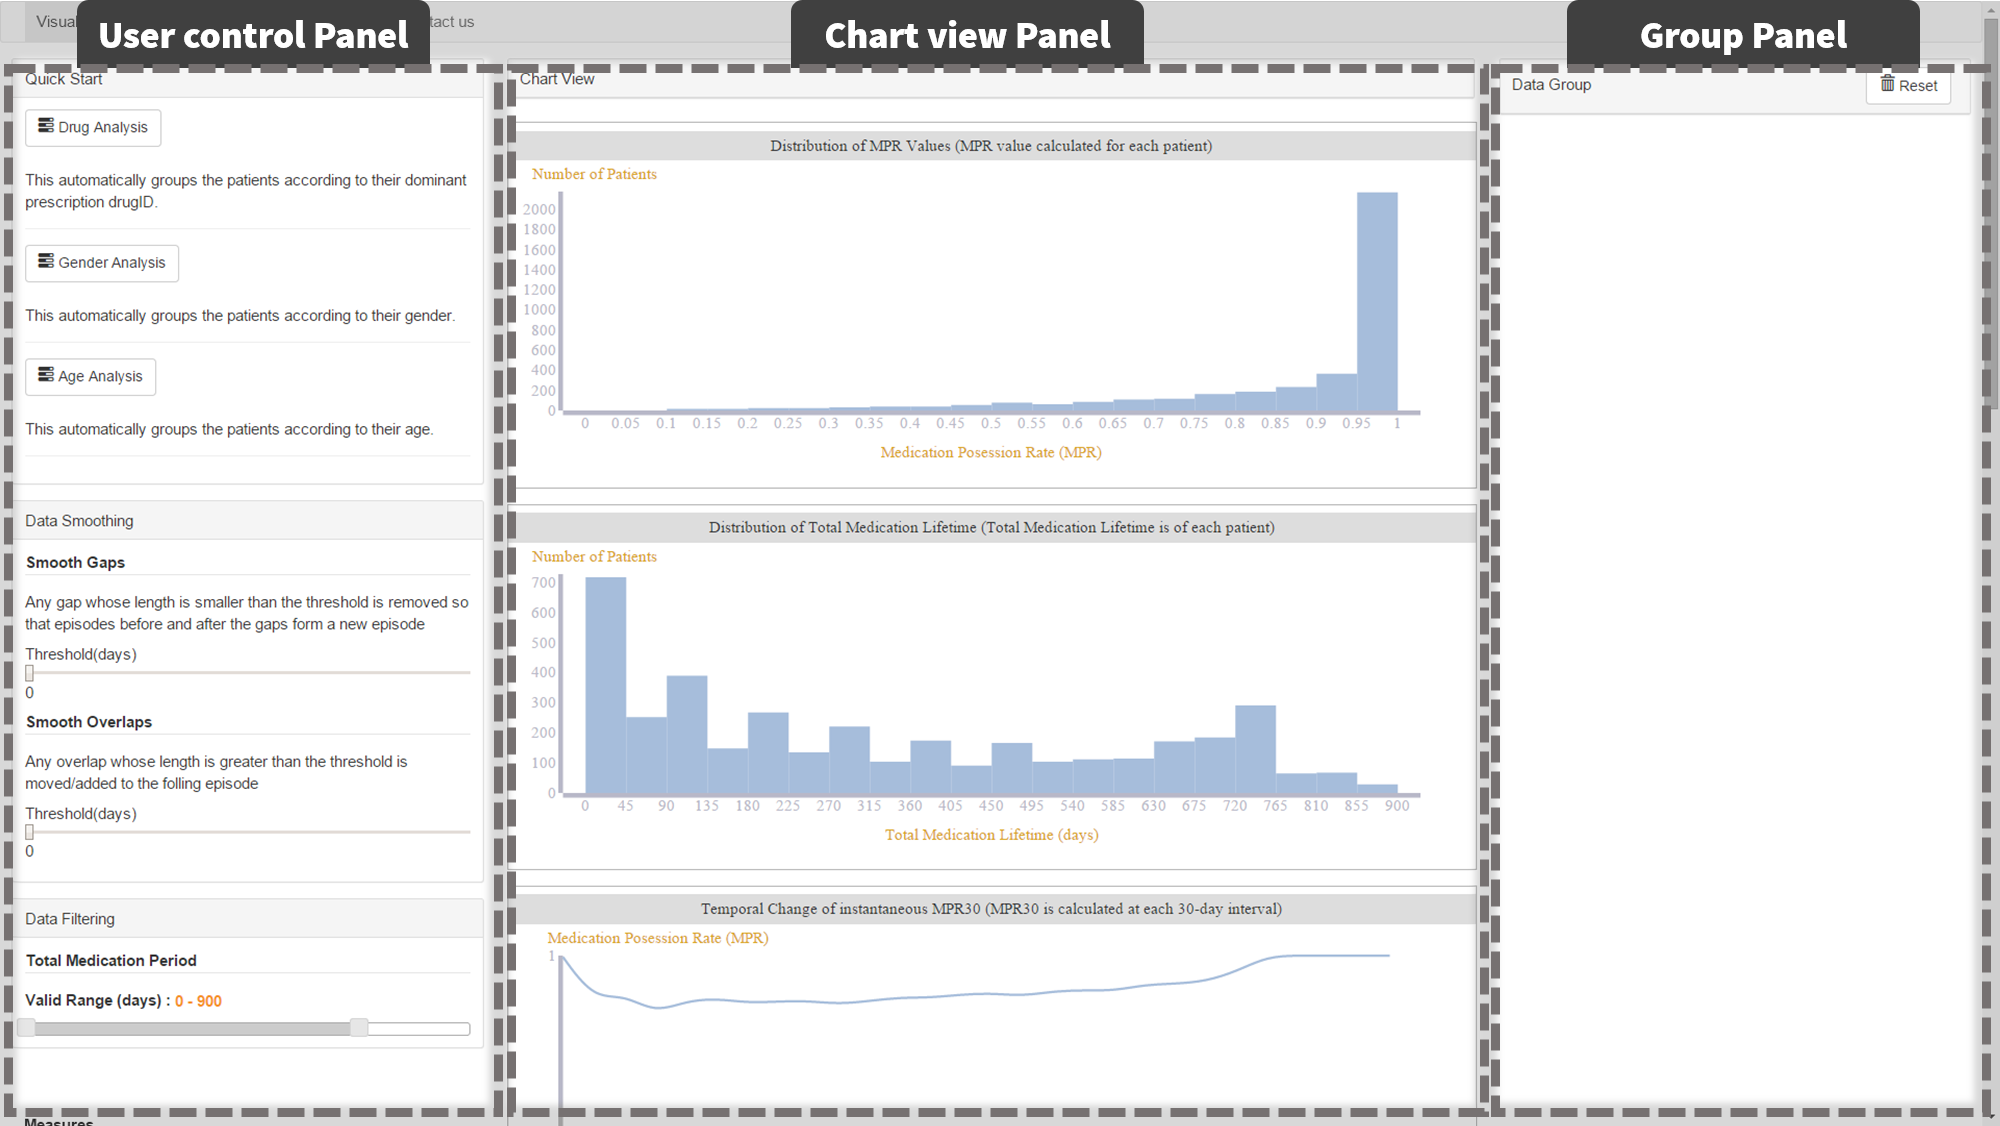
The user interface consists of three parts:
The user control panel
The chart view panel
The group panel
The user control panel houses controls to manipulate the dataset and support
exploratory visualizations. Based on these selections, the chart view panel
displays the relevant graphs. The group panel displays user generated or auto
created groups along with the size of the group, its definition, visibility, and
a legend.
Pilot Study
Before running the usability test, we conducted a pilot study with two participants from University of Maryland, College Park and University of Maryland School of Pharmacy. These sessions were conducted over Skype/in-person and sought preliminary feedback. We used this feedback to inform the design and functionality of our tool. One major feedback we received was to make the tool display feedback immediately when the parameters are changed.
